
About Image Histogram
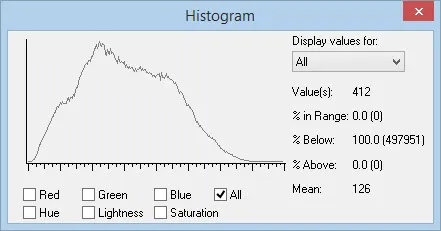
A histogram shows the distribution of an image’s pixel values in a chart. The left end of the graph represents the darker pixels, the middle represents gray values and the right end of the graph represents the lighter pixels. The height of the points on the graph represent the number of pixels with that same value or at that same level.
There really is no such thing as a good histogram or a bad histogram. A histogram is simply a graph of the way things are in the image.
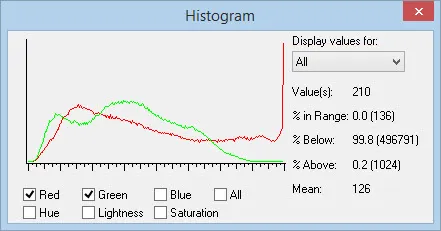
Use the checkboxes below the graph to display the histogram for each channel. The graphs are scaled to show maximum values. As a result, when multiple channels are selected for display, the graphs will redraw completely to accommodate the new scaling.
This dialog is informational only. It does not make any adjustments to the image. The dialog can remain open while other dialogs are used to make changes to the image. The graphs will update automatically whenever you save the image.
With an image on the Image Worktable, click Image > Histogram > Histogram from the file menu.
There really is no such thing as a good histogram or a bad histogram. A histogram is simply a graph of the way things are in the image.
To view information about a specific area of the histogram, place the mouse cursor over the graph. The values displayed in the dialog box are for the channel selected in the drop-down under Display values for. To select a range of values, drag holding down the left mouse button.
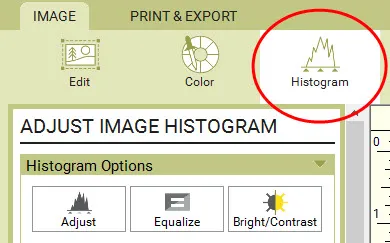
Adjust Image Histogram

To view the Adjust Histogram dialog, go to the Image Worktable > Image tab > Histogram in the ribbon and Adjust in the palette.
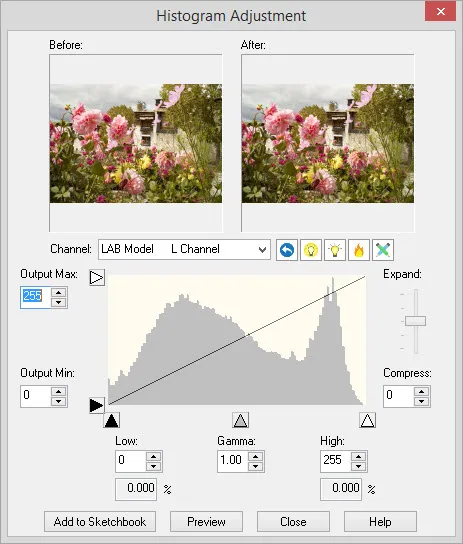
The histogram adjustment dialog lets you change the brightness and contrast of the image. Changes can be made by typing new values, clicking the arrow buttons, or by dragging the triangle-shape controls or slider along the edges of the histogram graph.
The graph will display the histogram for the current image in gray. The left end of the graph represents black and the right end of the graph represents white.
- If the gray graph does not reach the lower left corner, then the darkest pixels in the image are not completely black.
- If the gray graph does not reach the lower right corner, then the lightest pixels in the image are not completely white.
As the controls in the dialog are used to change the image, the new histogram reflecting the adjustments will appear in red.
Channel
The most common color model is RGB where the triplet refers to red, green and blue. A color defined by these values represents a point in a three-dimensional color space. Other color models have been developed to correlate with human perception. These models are all different ways of dividing the color space. These models all have luminance as one of the triplet parameters.
- LAB Model: The L stands for luminance. A controls the magenta to green spectrum and B controls the yellow to blue spectrum.
- YUV Model: The Y stands for luminance. U and V represent the color information in terms of red (U) and blue (V).
- YIQ Model: The Y stands for luminance. I stands for in-phase and indicates a range from orange to blue. Q stands for quadrature and indicates a range from purple to green.
Preset Buttons
- Reset to default: Use to restore all the values to the original settings.
- Glow: Use to increase the contrast between light and dark in the image.
- Lighten: Use to lighten the darkest pixels of the image.
- Warm: Use to lighten overall by converting many in the range of lighter pixels to the same value.
- Pastel: Use to apply extreme lightening to the darkest pixels of the image.
Adjusting Brightness
- Output Max: To darken the lightest pixels in the image, drag the Max control (white triangle on the top left edge of histogram) down.
- Output Min: To lighten the darkest pixels in the image, drag the Min control (black triangle on the lower left edge of histogram) up.
Adjusting Contrast
- Low: As you drag the Low control (black triangle on the bottom left edge) to the right, all pixels values to the left of the control get converted to the level of the control. This has the effect of making the image darker since many pixels of various values all get converted to the same value. The color that the pixels convert to is black if the Output Min control is set to zero, otherwise the color is the value of the Output Min control. If there is a gap before the gray histogram begins to rise, then no pixels are affected until the control reaches the beginning of the gray graph.
Percentage readout: The percentage value below the Low control displays the percentage of pixels that are between zero and the low value. Contrast for these pixels will be lost since they get converted to the same value.
- High: As you drag the High control (white triangle on the bottom right edge) to the left, all pixels values to the right of the control get converted to the level of the control. This has the effect of making the image lighter since many pixels of various values all get converted to the same value. The color that the pixels convert to is white if the Output Max control is set to 255, otherwise the color is the value of the Output Min control. If there is a gap before the gray histogram reaches the right edge of the graph, then no pixels are affected until the control reaches the beginning of the gray graph.
Percentage readout: The percentage value below the High control displays the percentage of pixels that are between 255 and the high value. Contrast for these pixels will be lost since they get converted to the same value.
- Gamma: The Gamma control adjusts midtone brightness. This control helps prevent from pushing some parts of the image into becoming over-exposed or under-exposed. White will still be white. Black will still be black, and everything between will just be pushed upwards or downwards but not out of range. The range for this control is 0.2 to 5.0.
- Expand/Compress: The slider along the right edge of the histogram will adjust the midtones of the image. Drag the slider up to expand. You will notice that the red histogram will spread out and expand, adding more extreme lights and darks to the image. In other words, the darks get darker and the lights get lighter. Drag the slider down to compress. This will create a peak in the red histogram in the middle of the graph resulting in more gray-looking image.
Equalize Histogram

To view the Equalize Histogram dialog, go to the Image Worktable > Image tab > Histogram in the ribbon and Equalize in the palette.
Equalize Histogram is a method of increasing the contrast in an image. You may find it useful to use in images that are over or under-exposed. Just as the name implies, it spreads out or levels off the intensities, or the spikes in the histogram, which allows the lower contrast areas to gain a higher contrast.
The weakness of this method is that it is across-the-board so it may result in producing unrealistic effects in photos. The strength of this method is that it can produce wonderful contrasts in localized parts of an image that could then be used for creating symmetries and other beautiful patterns to print on fabric.
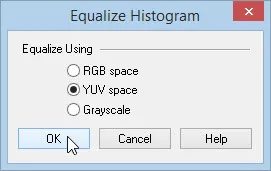
The Equalize Histogram dialog lets you select the color space to equalize. The possible values are:
- RGB – Linearizes the number of pixels across the RGB color space. Each channel (red, green blue) is done separately.
- YUV – Linearizes the number of pixels across the YUV color space. This usually gives the best results because YUV incorporates human perception like in your color television.
- Grayscale – Linearizes the number of pixels per gray level in a gray level representation of the image.
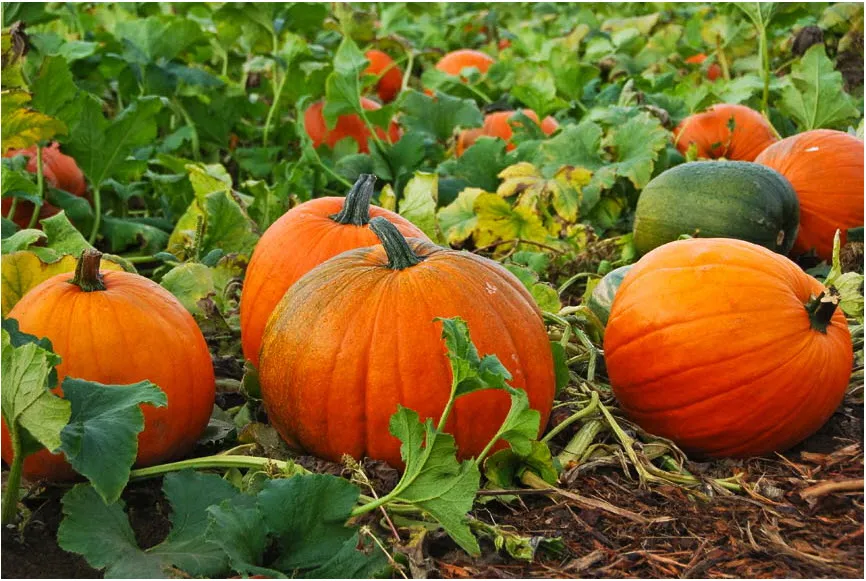
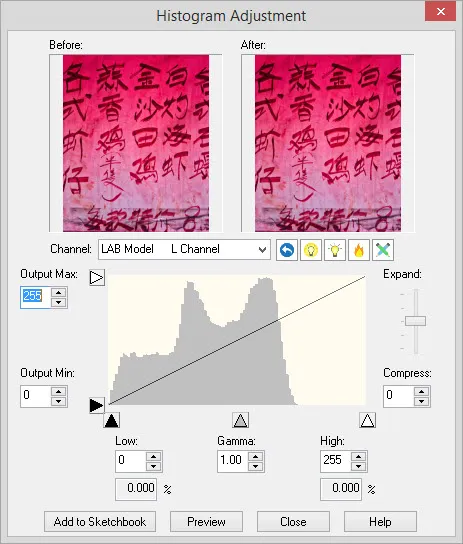
Click Adjust in the Histogram Options palette. Notice the histogram has severe spikes and drops off to the right indicating there are very few light pixels.
Click Close.
Click Equalize in the Histogram Options palette.
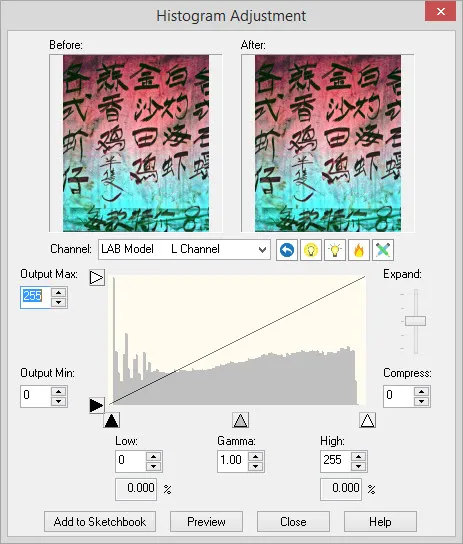
Open the adjustment again, by clicking Adjust in the Histogram Options palette. The equalized histogram now extends more evenly to both ends of the graph.
Brightness/Contrast

To view the Brightness/Contrast dialog, go to the Image Worktable > Image tab > Histogram in the ribbon and Brightness/Contrast in the palette.
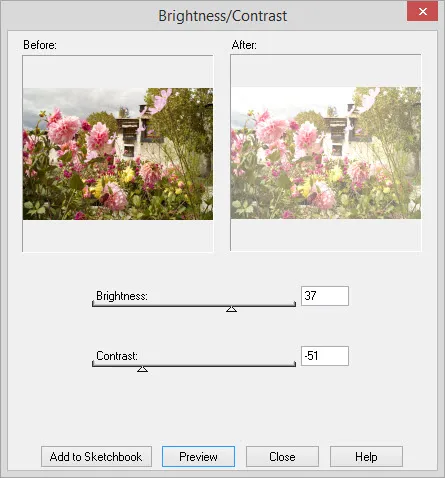
The Brightness/Contrast dialog box lets you do overall and equal adjustments to all the pixels in an image. Increasing brightness moves the histogram to the right and decreasing moves the histogram to the left. Increasing contrast widens the histogram and decreasing contrast narrows the histogram.
Brightness: Dragging the brightness slider to the right increases the brightness until it becomes completely white at the maximum level. Dragging the slider to the left decreases the brightness making the image darker and darker until it is totally black. Values range from -100 to 100. A value of 0 preserves the original setting.
Contrast: Dragging the contrast slider to the right increases the saturation or intensity of each pixel in the image. Dragging the slider to the left desaturates the intensity of each pixel so that it becomes more and more gray or dull looking. Values range from -100 to 100. A value of 0 preserves the original setting.
Note:
Depending on the image, you may find that you have more independent control of brightness and contrast using the Histogram Adjustment dialog.


